Login
Accessing this course requires a login. Please enter your credentials below!
Data means facts. Data consists numbers, letters, symbols and transactions.
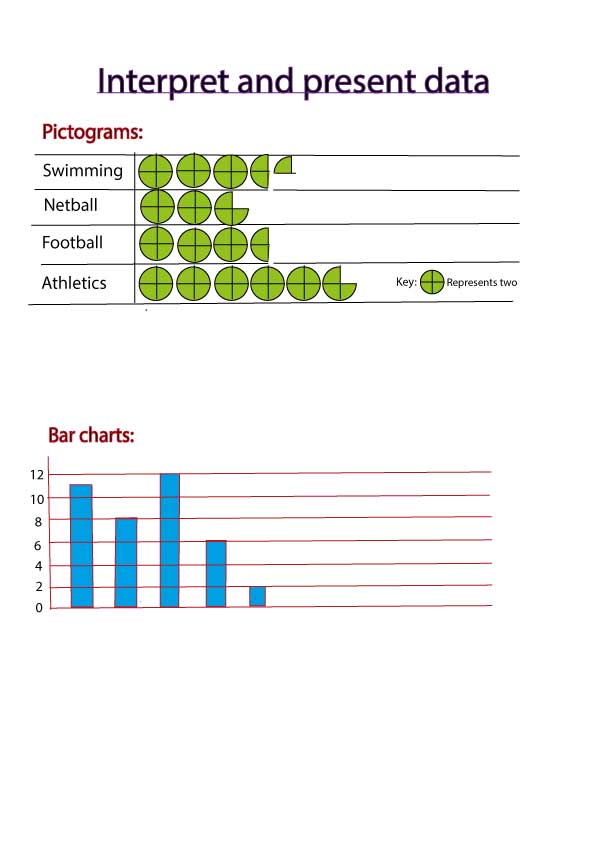
Data is often easier to understand if it presented in the form of graph or diagram.
The information for a graph or diagram is often given in a frequency table.
A frequency table gives the name of each category of data, (list of items) and the number of items.
A pictogram uses symbols to represent data. A pictogram must have a key, which shows how many items of data each symbol represents.
